
What is a deadlock?
A deadlock occurs when two or, more sessions/ processes are waiting on each other to release the lock held by another sessions/ processes.
Once a deadlock scenario is detected, Oracle will perform a statement-level rollback to one of the sessions (deadlock participants). The session of which the statement is being rolled back, will encounter an “ORA-00060/ ORA-4020: Deadlock detected while waiting for resource.” error message.
How to troubleshoot a deadlock situation?
There are a ton of articles with several approaches on how to troubleshoot a deadlock situation including documents available on MOS. However, in my opinion, it boils down to:
- How can you avoid a deadlock scenario, and
- How to act once a deadlock situation is encountered.
So, I will not go into the troubleshooting details, however, please check the “references” section of this article to quickly browse through them if that is the intent.
How to monitor a deadlock?
In Oracle RAC, for both enqueue and library cache deadlock events (ORA-00060 and ORA-4020), a related generic message (Global Enqueue Services Deadlock detected) is recorded in the database alert log. The trace files which gets generated in each scenario, would have a difference in the naming convention. The trace file which gets generated as a result of enqueue deadlock will have the following naming convention: <SID>_ora_<pid>.trc.
On the other hand, if a deadlock was encountered because of library cache, the trace file will have the following naming convention: <SID>_lmd0_<pid>.trc.
You can easily find the alert and trace file location by executing the below command:
select di.value PATH, 'alert_' || i.instance_name || '.log' ALERT_LOG from v$diag_info di, v$instance i where di.name = 'Diag Trace';
While Oracle database is smart enough to handle a deadlock situation and perform the required action (statement rollback), often, it is necessary to be alerted if such a situation occurs. One obviously would not want too many deadlocks occurring in the database.
To achieve this, I will detail 3 methods to get alerted when a deadlock occurs in the database.
Method 1: OMC (Oracle Management Cloud)
OMC is the next generation cloud-based offering from Oracle with integrated monitoring, management and analytics. It works equally for your cloud or, on-premise environment.
If you have OMC configured and working, follow the below procedure to monitor, analyze and get alerted for a deadlock scenario.
Login to OMC and click on “Log Analytics”.

In “Log Explorer”, Click on “Database Alert Logs”.
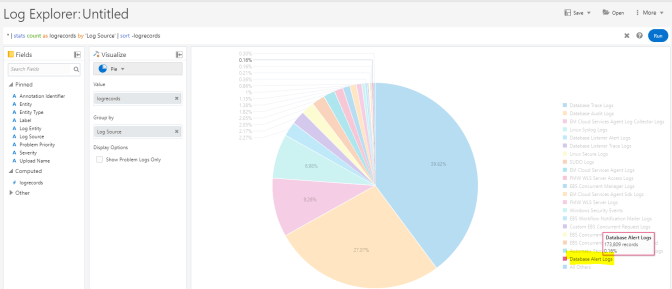
Type or, copy/paste the following into the query criteria and click on “RUN”:
'Problem Priority' != null and Label = Deadlock | timestats count as logrecords by Entity | sort -logrecords
Additionally, you can specify the entity name to narrow to a specific instance or, instances:
'Problem Priority' != null and Label = Deadlock and Entity = 'My_prod_DB/database/dbprd1' | timestats count as logrecords by Entity | sort -logrecords
'Problem Priority' != null and Label = Deadlock and Entity in ('My_prod_DB/database/dbprd1' , 'My_prod_DB/database/dbprd2' , 'My_QA_DB/database/dbqa1' , 'My_QA_DB/database/dbqa2' | timestats count as logrecords by Entity | sort -logrecords

Based on the date criteria defined (can be easily changed from the dropdown on top right hand corner), it will instantly populate the graph with deadlock occurrences.
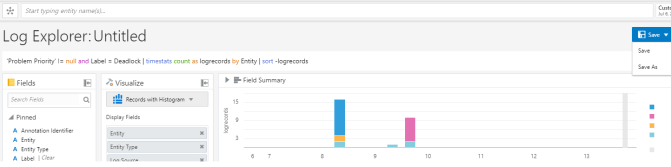
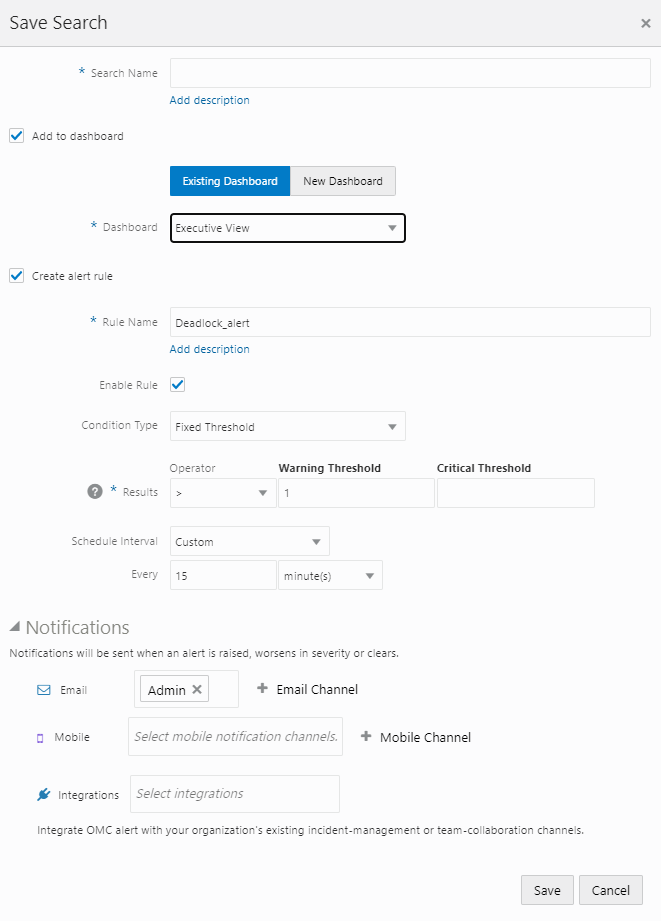
While you can choose to analyze the details, click on “Save as” to either add the graph as custom widget to an existing OMC dashboard and / or, setup an alert rule.
The notifications section of the pop-up window lets you choose on who should be alerted and how. Click on “Save” and you will get notified based on the settings you chose.
Method 2: OEM Monitoring Template
Oracle Enterprise has always been a preferred choice when monitoring of Oracle environment is concerned. On your OEM instance, click on Enterprise and navigate to Monitoring –> Monitoring Templates.

Select the monitoring template you have configured for target type: “database instance” and click on Edit.

Provide / add ORA-0060 and ORA-4020 as one of the criteria for warning or, critical thresholds and click on OK. Based on the incident rules you have configured for this monitoring template, you will get alerted once a deadlock condition is logged in the alert log.

Method 3: Custom Script
Use the below script to get an e-mail-based alert when a deadlock situation occurs and “Global Enqueue Services Deadlock detected” message appears in the database alert log.
The script can be executed as part of OEM custom metric or, job and can also be added as part of cron.
SET SERVEROUTPUT ON;
SET DEFINE OFF;
DECLARE
LONG_RUNNING NUMBER := 0;
P_SMTP_HOST VARCHAR2(30) := 'your_smtp_server.yourcompany.com'; --< Provide the SMTP Host name here
P_SMTP_PORT NUMBER := 25;
V_DB_NAME VARCHAR(20);
V_ALERT_TIME VARCHAR(20);
V_ALERT_MESSAGE VARCHAR(2000);
P_FROM VARCHAR2(30) := 'noreply@your_company.com'; --< Provide the sender's e-mail address here. This must be one e-mail address only
P_RECIPIENTS VARCHAR2(500) := 'Support_DL_1@your_company.com, Support_DL_2@your_company.com'; --< Provide comma separated list of recipients.
P_SUBJECT VARCHAR2(100);
P_MESSAGE VARCHAR2(4000);
L_MAIL_CONN UTL_SMTP.CONNECTION;

BEGIN
SELECT COUNT (*) INTO LONG_RUNNING from (SELECT originating_timestamp, message_text
FROM v$diag_alert_ext
WHERE originating_timestamp > cast(sysdate-0.25/24 as timestamp)
AND message_text like '%Global Enqueue Services Deadlock detected%')
WHERE rownum = 1;
dbms_output.put_line('Number of Deadlock occurances in last 15 mins: ' || LONG_RUNNING);
IF LONG_RUNNING > 0 THEN
--dbms_output.put_line('Let us send email');
DECLARE my_recipients VARCHAR2(32000);
location NUMBER := 0;
my_index NUMBER := 1;
BEGIN

SELECT * INTO V_DB_NAME, V_ALERT_TIME, V_ALERT_MESSAGE
from (SELECT b.instance_name, TO_CHAR (a.originating_timestamp, 'DD-MON-YYYY HH24:MI:SS') alert_time, a.message_text alert_message
FROM v$diag_alert_ext a, v$instance b
WHERE a.originating_timestamp > cast(sysdate-0.25/24 as timestamp)
AND a.message_text like '%Global Enqueue Services Deadlock detected%')
WHERE rownum = 1;
dbms_output.put_line('Number of Deadlock occurances in last 15 mins: ' || LONG_RUNNING);

P_SUBJECT := 'Deadlock Alert' || '-' || V_DB_NAME;
P_MESSAGE := 'A deadlock has been detected in ' || V_DB_NAME || '. ' ||
'Please see below details and take appropriate action: ' || CHR(10) || CHR(10) ||
' ============================================= ' || CHR(10) ||
' Deadlock Occurred at: ' || V_ALERT_TIME || CHR(10) || CHR(10) ||
' Alert Message: ' || V_ALERT_MESSAGE || CHR(10) ||
' ============================================= ' || CHR(10) || CHR(10) ||
'Regards,' || CHR(10) ||
'OEM Monitoring-Your Team';
L_MAIL_CONN := UTL_SMTP.open_connection(P_SMTP_HOST, P_SMTP_PORT);
UTL_SMTP.helo(L_MAIL_CONN, P_SMTP_HOST);
UTL_SMTP.mail(L_MAIL_CONN, P_FROM);

my_recipients := RTRIM(P_RECIPIENTS,',; ');
my_index := 1;

WHILE my_index < LENGTH(my_recipients) LOOP
location := INSTR(my_recipients,',',my_index,1);
IF location = 0 THEN
location := INSTR(my_recipients,';',my_index,1);
END IF;

IF location <> 0 THEN
UTL_SMTP.RCPT(L_MAIL_CONN, TRIM(SUBSTR(my_recipients,my_index,location-my_index)));
my_index := location + 1;
ELSE
UTL_SMTP.RCPT(L_MAIL_CONN, TRIM(SUBSTR(my_recipients,my_index,LENGTH(my_recipients))));
my_index := LENGTH(my_recipients);
END IF;
END LOOP;

my_recipients := REPLACE(my_recipients,';',',');
UTL_SMTP.open_data(L_MAIL_CONN);
UTL_SMTP.write_data(L_MAIL_CONN, 'Date: ' || TO_CHAR(SYSDATE, 'DD-MON-YYYY HH24:MI:SS') || UTL_TCP.crlf);
UTL_SMTP.write_data(L_MAIL_CONN, 'To: ' || my_recipients || UTL_TCP.crlf);
UTL_SMTP.write_data(L_MAIL_CONN, 'From: ' || P_FROM || UTL_TCP.crlf);
UTL_SMTP.write_data(L_MAIL_CONN, 'Subject: ' || P_SUBJECT || UTL_TCP.crlf);
UTL_SMTP.write_data(L_MAIL_CONN, 'Reply-To: ' || P_FROM || UTL_TCP.crlf || UTL_TCP.crlf);

UTL_SMTP.write_data(L_MAIL_CONN, P_MESSAGE || UTL_TCP.crlf || UTL_TCP.crlf);
UTL_SMTP.close_data(L_MAIL_CONN);

UTL_SMTP.quit(L_MAIL_CONN);

END;
END IF;
END;
/
Additional documents for reference:
Document 1443482.1 Troubleshooting “Global Enqueue Services Deadlock detected”
Document 62365.1 What to do with “ORA-60 Deadlock Detected” Errors
Document 62354.1 TX Transaction locks – Example wait scenarios
Document 262226.1 Deadlock Error Not in Alert.log and No Trace File Generated on OPS or RAC (this document covers Global Wait-For-Graph(WFG))
Discover more from IT-Noesis
Subscribe to get the latest posts sent to your email.

Beautiful explanation of Deadlock in very general terms and later on provided very detailed explanations and troubleshooting steps :
LikeLike